
The output of the visualization produced by your analysis is usually found in the tool or platform where you created it. This can be within a software application, online dashboard, or stored as a file.
Data visualization helps in understanding complex information easily. It turns raw data into visual graphs, charts, and maps. But finding where these visualizations are stored can be tricky. It depends on the tool you use. Some tools save them locally on your computer.
Others store them in the cloud. Knowing where to find your output is crucial. It allows you to share insights with others. In this post, we will explore different places where you can find the output of your visualizations. Stay tuned to learn more about accessing your valuable data insights.
Credit: www.absint.com
Data Analysis Tools
Data analysis tools help you make sense of raw data. They turn complex numbers into visual insights. These insights are easy to understand and act upon. Different tools are available for different needs. Let’s explore some of the common tools and where you can find the output of your visualizations.
Common Tools
Several tools are popular for data analysis. Each has unique features and output locations. Here are some of the most used:
- Excel: A versatile tool for basic to intermediate data analysis.
- Tableau: Great for creating interactive and shareable dashboards.
- Power BI: Integrates well with other Microsoft products.
- Python (with libraries like Matplotlib and Seaborn): Ideal for detailed and custom visualizations.
- R (with libraries like ggplot2): Excellent for statistical analysis and visualization.
Output Locations
Each tool has different ways to store and share visualizations. Knowing where to find your output is crucial.
| Tool | Output Location |
|---|---|
| Excel | Within the workbook itself. Can be exported as images or PDFs. |
| Tableau | Tableau Server or Tableau Public. Can also export as images or PDFs. |
| Power BI | Power BI Service for sharing. Can be exported as images, PDFs, or PowerPoint files. |
| Python | Local files as images (PNG, JPEG) or embedded in Jupyter Notebooks. |
| R | Local files as images (PNG, JPEG) or embedded in R Markdown reports. |
These tools and output locations help you share your insights effectively. Choose the right tool for your needs. Then, you can easily find and share your analysis results.
Business Intelligence Platforms
Business intelligence platforms help organizations turn data into actionable insights. These platforms provide tools for analyzing data and creating visualizations. Users can then share these visualizations with others. The right platform can make data analysis easier and more effective.
Popular Platforms
There are several popular business intelligence platforms available today. Here are some of the most widely used:
- Tableau: Known for its interactive and user-friendly interface. It supports a wide range of data sources.
- Power BI: Developed by Microsoft. It integrates well with other Microsoft products.
- Looker: Offers powerful data exploration features. It is part of the Google Cloud Platform.
- QlikView: Focuses on providing associative data models. It is known for its flexibility and speed.
Retrieving Visualizations
Each platform has its own method for accessing visualizations. Below is a brief overview:
| Platform | How to Retrieve Visualizations |
|---|---|
| Tableau | Use the dashboard and share via Tableau Server or Tableau Online. |
| Power BI | Access reports through Power BI Service or embed in apps. |
| Looker | Share dashboards through Looker’s web interface or embed them. |
| QlikView | Distribute reports via QlikView Publisher or share through web links. |
These platforms offer different ways to share and access visualizations. Choose the one that fits your needs best.
Data Science Notebooks
Data science notebooks are essential tools for data analysis. They allow users to write and execute code, visualize data, and document their findings. These notebooks offer an interactive environment, making data exploration and analysis more efficient. Among the popular choices are Jupyter Notebooks and Google Colab.
Jupyter Notebooks
Jupyter Notebooks are widely used in the data science community. They support multiple programming languages, including Python, R, and Julia. Users can create and share documents that contain live code, equations, visualizations, and narrative text. The output of your analysis, such as charts and graphs, appears right below the code cells. This makes it easy to see results immediately.
Jupyter Notebooks also integrate well with many data visualization libraries. Libraries like Matplotlib, Seaborn, and Plotly can be used seamlessly. This flexibility allows for detailed and interactive visualizations. Additionally, notebooks can be shared with colleagues or published online. They are versatile and support collaborative data science projects.
Google Colab
Google Colab, short for Colaboratory, is another popular data science notebook. It is a free cloud-based platform that supports Python. Users can write and execute Python code right in their browsers. One major advantage is that it provides free access to GPUs. This speeds up computations significantly.
The output of your visualizations is displayed directly in the notebook cells. This allows for easy examination of results. Google Colab also supports integration with Google Drive. You can save and share your notebooks effortlessly. It is particularly useful for collaborative work. Multiple users can work on the same notebook simultaneously. This enhances teamwork and productivity.

Credit: ai.gopubby.com
Cloud-based Solutions
Cloud-based solutions offer a reliable way to store and share your visualizations. These platforms provide the tools needed to handle large datasets and complex computations. They also allow for easy collaboration and access from anywhere in the world.
Aws And Azure
AWS and Azure are two popular cloud services for data visualization. AWS offers services like Amazon QuickSight. It allows users to create and share interactive dashboards. Azure provides Power BI for similar purposes. Both platforms offer extensive documentation and support.
Google Cloud Platform
Google Cloud Platform (GCP) also offers powerful visualization tools. Google Data Studio is a free tool available on GCP. It helps create interactive reports and dashboards. GCP ensures your data is secure and accessible at all times. The platform supports seamless integration with other Google services.
Local Storage
When working with data visualization, local storage is a reliable option for saving your work. It ensures you have quick access to your visualizations without relying on an internet connection. Let’s explore the different ways to store your visualization output locally.
Desktop Applications
Many desktop applications offer features to save visualizations directly on your computer. These applications include:
- Tableau: Save visualizations as Tableau files (.twbx).
- Microsoft Excel: Export charts and graphs as images or Excel files.
- Power BI Desktop: Save reports and visualizations as .pbix files.
Using desktop applications provides control over your data. You don’t need an internet connection to access your visualizations. This is especially useful for sensitive data that shouldn’t be uploaded online.
File Formats
Choosing the right file format is crucial for storing and sharing visualizations. Different formats serve different purposes:
| File Format | Description | Best Used For |
|---|---|---|
| PNG | Image format | Sharing static visualizations |
| Document format | Print-ready visualizations | |
| CSV | Text format | Sharing raw data |
| JSON | Data format | Data exchange and APIs |
Consider the purpose of your visualization when selecting a format. For instance, PNG is great for images. PDF is suitable for documents. CSV and JSON are best for data exchange.
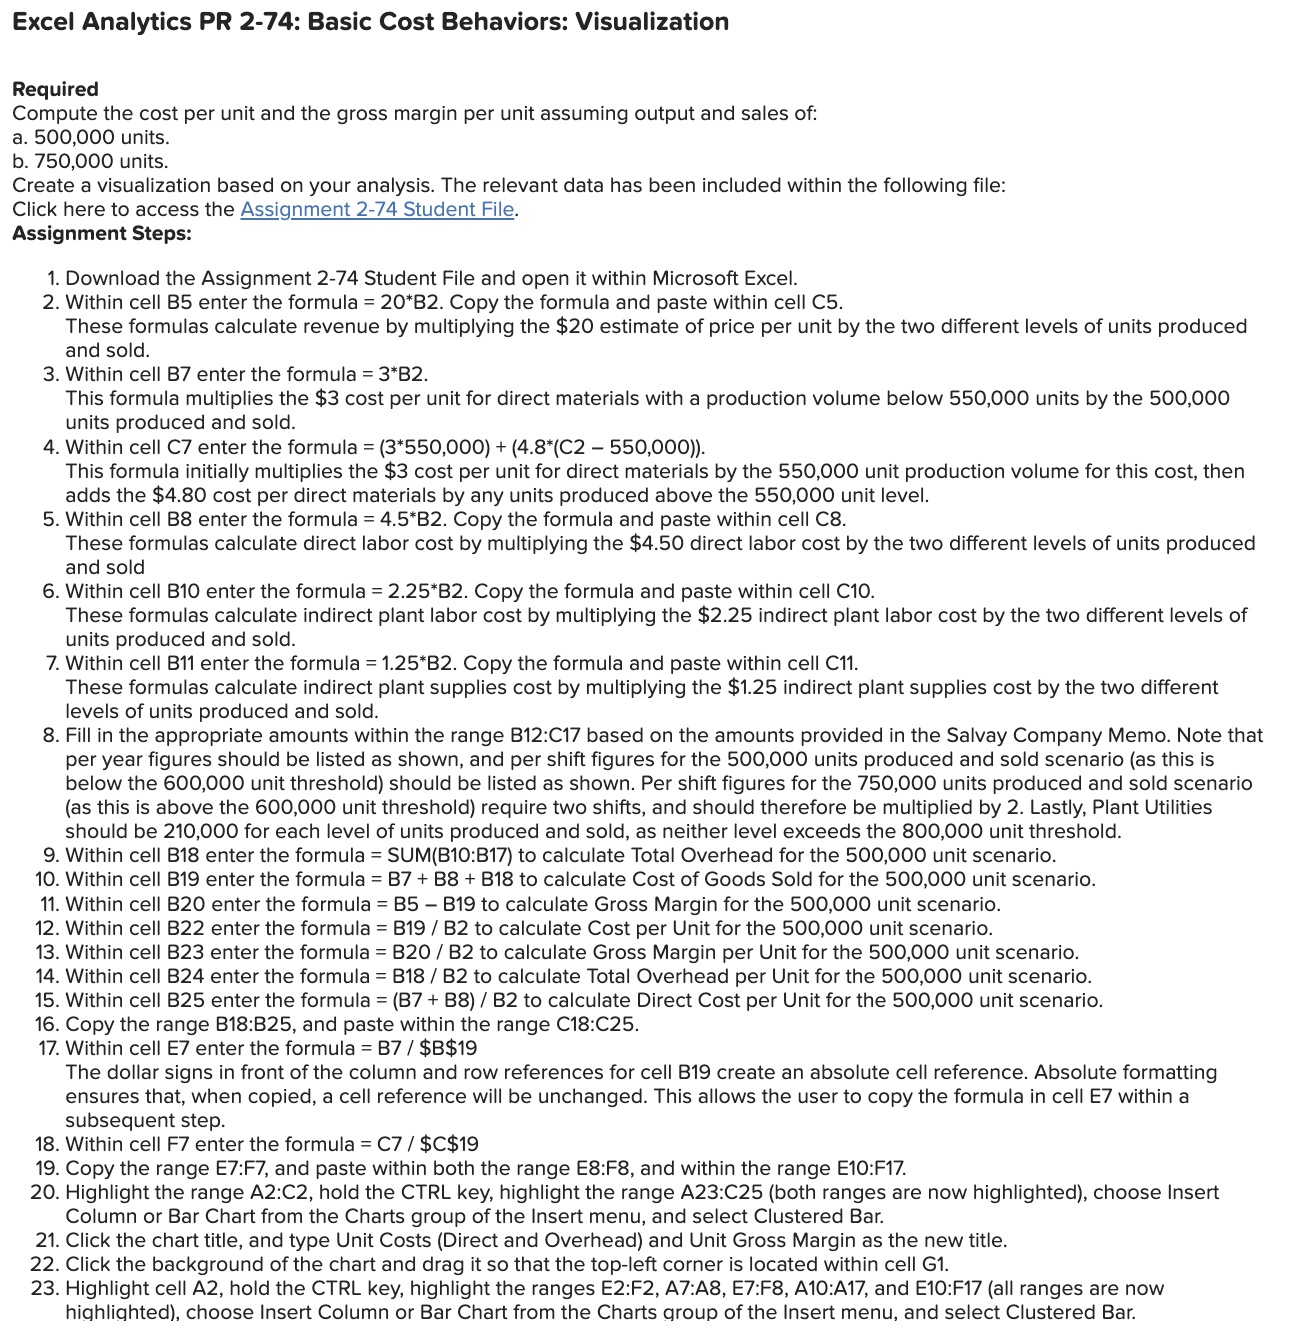
Credit: www.chegg.com
Sharing And Collaboration
Sharing and collaborating on the output of your data visualizations can greatly enhance your team’s understanding and decision-making. Effective sharing ensures all stakeholders have access to up-to-date information. Collaboration tools make it easier to work together and refine your insights. Here’s how you can share your visualizations and collaborate with your team.
Online Dashboards
Online dashboards are a popular way to share data visualizations. They provide a centralized location for all your charts, graphs, and reports. Users can access these dashboards from any device with an internet connection. This ensures everyone is on the same page.
Some of the most widely used online dashboard tools include:
- Tableau
- Power BI
- Google Data Studio
These tools offer interactive features. Users can filter data, drill down into details, and view updates in real-time. Customizable settings allow you to control who can view or edit the dashboard. This is crucial for maintaining data security while enabling collaboration.
Team Collaboration Tools
Team collaboration tools are essential for sharing data visualizations within a team. They integrate with various data visualization platforms and enhance communication. These tools ensure that everyone stays informed and can contribute their insights.
Some popular team collaboration tools include:
- Slack
- Microsoft Teams
- Asana
These tools allow you to share links to your visualizations, discuss findings, and assign tasks. You can create dedicated channels or groups for specific projects. This makes it easier to organize discussions and keep track of progress.
Using these tools can also streamline feedback. Team members can comment directly on shared visualizations, making it easier to refine and improve your analysis.
Best Practices
In data analysis, visualizations are vital for presenting insights. Following best practices ensures your visualizations are effective and accessible. Let’s explore some best practices in organizing outputs and ensuring accessibility.
Organizing Outputs
Organizing your visualization outputs is crucial for clarity. Here are some tips:
- Consistent Naming Conventions: Use descriptive and consistent names for files and folders.
- Folder Structure: Create a logical folder structure. For example:
- Root Folder
- — Data
- — Visualizations
- — Reports
- Version Control: Keep track of changes with version numbers or dates.
Ensuring Accessibility
Making your visualizations accessible is vital for a broader audience. Consider these practices:
- Alt Text: Add descriptive alt text to all images.
- Color Contrast: Ensure high color contrast for readability.
- Interactive Elements: Include interactive elements like tooltips for more details.
By organizing outputs and ensuring accessibility, your visualizations will be clear and reach a wider audience.
Frequently Asked Questions
Where To Find Visualization Output?
You can find the visualization output in the designated output folder of your analysis tool.
How To Access Analysis Visualization?
Access your analysis visualization through the results section of your data analysis software.
Which Tools Display Analysis Visualization?
Tools like Tableau, Power BI, and Excel can display the output of your analysis visualization.
Can I Download Analysis Visualization?
Yes, most analysis tools allow you to download the visualization in various formats like PNG or PDF.
Conclusion
Finding the output of your analysis is crucial for data-driven decisions. Look in your analysis tool’s designated output section. This might be in dashboards, reports, or export files. Ensure you save or document this output for future reference. Properly locating this information helps in making informed choices.
Always double-check where your tool stores visualizations. This way, you can efficiently access and use your data insights. Happy analyzing!